a post with tabs
This is how a post with tabs looks like. Note that the tabs could be used for different purposes, not only for code.
First tabs
With this you can generate visualizations like:
-
var_dump('hello'); -
console.log("hello"); -
pputs 'hello'
% This quicksort algorithm is extracted from Chapter 7, Introduction to Algorithms (3rd edition)
\begin{algorithm}
\caption{Quicksort}
\begin{algorithmic}
\PROCEDURE{Quicksort}{$$A, p, r$$}
    \IF{$$p < r$$}
        \STATE $$q = $$ \CALL{Partition}{$$A, p, r$$}
        \STATE \CALL{Quicksort}{$$A, p, q - 1$$}
        \STATE \CALL{Quicksort}{$$A, q + 1, r$$}
    \ENDIF
\ENDPROCEDURE
\PROCEDURE{Partition}{$$A, p, r$$}
    \STATE $$x = A[r]$$
    \STATE $$i = p - 1$$
    \FOR{$$j = p$$ \TO $$r - 1$$}
        \IF{$$A[j] < x$$}
            \STATE $$i = i + 1$$
            \STATE exchange
            $$A[i]$$ with $$A[j]$$
        \ENDIF
        \STATE exchange $$A[i]$$ with $$A[r]$$
    \ENDFOR
\ENDPROCEDURE
\end{algorithmic}
\end{algorithm}
Which generates:
{
  "$schema": "https://vega.github.io/schema/vega-lite/v5.json",
  "description": "A dot plot showing each movie in the database, and the difference from the average movie rating. The display is sorted by year to visualize everything in sequential order. The graph is for all Movies before 2019.",
  "data": {
    "url": "https://raw.githubusercontent.com/vega/vega/main/docs/data/movies.json"
  },
  "transform": [
    {"filter": "datum['IMDB Rating'] != null"},
    {"filter": {"timeUnit": "year", "field": "Release Date", "range": [null, 2019]}},
    {
      "joinaggregate": [{
        "op": "mean",
        "field": "IMDB Rating",
        "as": "AverageRating"
      }]
    },
    {
      "calculate": "datum['IMDB Rating'] - datum.AverageRating",
      "as": "RatingDelta"
    }
  ],
  "mark": "point",
  "encoding": {
    "x": {
      "field": "Release Date",
      "type": "temporal"
    },
    "y": {
      "field": "RatingDelta",
      "type": "quantitative",
      "title": "Rating Delta"
    },
    "color": {
      "field": "RatingDelta",
      "type": "quantitative",
      "scale": {"domainMid": 0},
      "title": "Rating Delta"
    }
  }
}
This plot supports both light and dark themes.
This is an example post with advanced image components.
Image Slider
This is a simple image slider. It uses the Swiper library. Check the examples page for more information of what you can achieve with it.


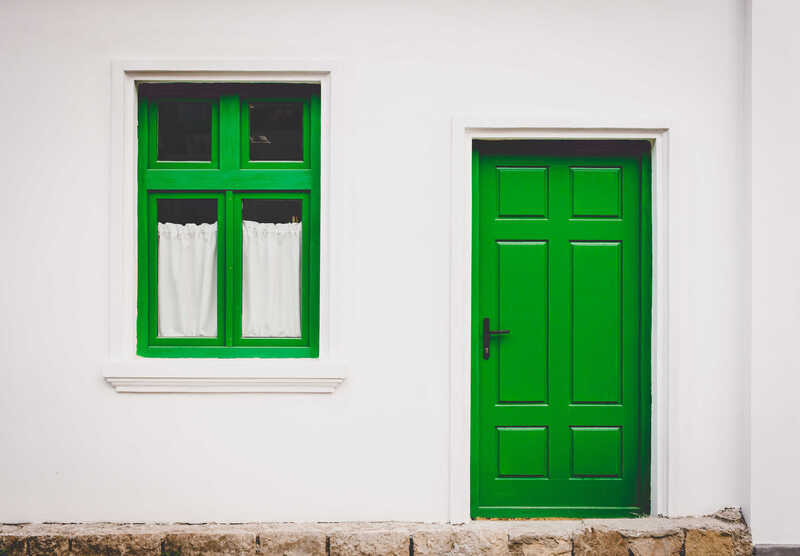
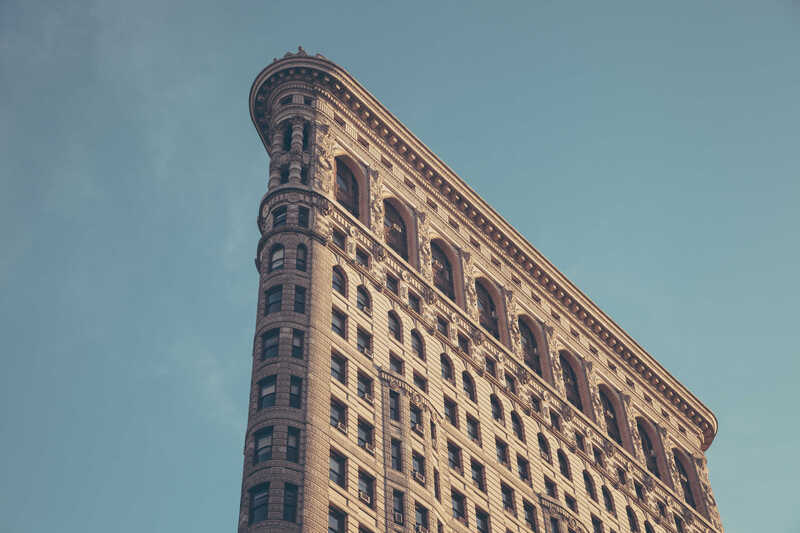

Image Comparison Slider
This is a simple image comparison slider. It uses the img-comparison-slider library. Check the examples page for more information of what you can achieve with it.


Which generates:
{
  "type": "FeatureCollection",
  "features": [
    {
      "type": "Feature",
      "properties": {},
      "geometry": {
        "coordinates": [
          [
            [
              -60.11363029935569,
              -2.904625022183211
            ],
            [
              -60.11363029935569,
              -3.162613728707967
            ],
            [
              -59.820894493858034,
              -3.162613728707967
            ],
            [
              -59.820894493858034,
              -2.904625022183211
            ],
            [
              -60.11363029935569,
              -2.904625022183211
            ]
          ]
        ],
        "type": "Polygon"
      }
    }
  ]
}
Which generates:
{
  "title": {
    "text": "ECharts Getting Started Example"
  },
  "responsive": true,
  "tooltip": {},
  "legend": {
    "top": "30px",
    "data": ["sales"]
  },
  "xAxis": {
    "data": ["Shirts", "Cardigans", "Chiffons", "Pants", "Heels", "Socks"]
  },
  "yAxis": {},
  "series": [
    {
      "name": "sales",
      "type": "bar",
      "data": [5, 20, 36, 10, 10, 20]
    }
  ]
}
Note that this library offer support for both light and dark themes. You can switch between them using the theme switcher in the top right corner of the page.
This is how it looks like:
{
  "type": "line",
  "data": {
    "labels": [
      "January",
      "February",
      "March",
      "April",
      "May",
      "June",
      "July"
    ],
    "datasets": [
      {
        "label": "# of bugs",
        "fill": false,
        "lineTension": 0.1,
        "backgroundColor": "rgba(75,192,192,0.4)",
        "borderColor": "rgba(75,192,192,1)",
        "borderCapStyle": "butt",
        "borderDash": [],
        "borderDashOffset": 0,
        "borderJoinStyle": "miter",
        "pointBorderColor": "rgba(75,192,192,1)",
        "pointBackgroundColor": "#fff",
        "pointBorderWidth": 1,
        "pointHoverRadius": 5,
        "pointHoverBackgroundColor": "rgba(75,192,192,1)",
        "pointHoverBorderColor": "rgba(220,220,220,1)",
        "pointHoverBorderWidth": 2,
        "pointRadius": 1,
        "pointHitRadius": 10,
        "data": [
          65,
          59,
          80,
          81,
          56,
          55,
          40
        ],
        "spanGaps": false
      }
    ]
  },
  "options": {}
}
Which generates:
{
  "type": "doughnut",
  "data": {
    "labels": [
      "Red",
      "Blue",
      "Yellow"
    ],
    "datasets": [
      {
        "data": [
          300,
          50,
          100
        ],
        "backgroundColor": [
          "#FF6384",
          "#36A2EB",
          "#FFCE56"
        ],
        "hoverBackgroundColor": [
          "#FF6384",
          "#36A2EB",
          "#FFCE56"
        ]
      }
    ]
  },
  "options": {}
}
> ##### TIP
>
> A tip can be used when you want to give advice
> related to a certain content.
{: .block-tip }
TIP
A tip can be used when you want to give advice related to a certain content.
> ##### WARNING
>
> This is a warning, and thus should
> be used when you want to warn the user
{: .block-warning }
WARNING
This is a warning, and thus should be used when you want to warn the user
> ##### DANGER
>
> This is a danger zone, and thus should
> be used carefully
{: .block-danger }
DANGER
This is a danger zone, and thus should be used carefully
This post shows how to add a table of contents as a sidebar.
Adding a Table of Contents
To add a table of contents to a post as a sidebar, simply add
toc:
  sidebar: left
This is an example post with videos. It supports local video files.
It does also support embedding videos from different sources. Here are some examples:
redirect: /assets/pdf/example_pdf.pdf
Redirecting to another page.
sequenceDiagram
    participant John
    participant Alice
    Alice->>John: Hello John, how are you?
    John-->>Alice: Great!
This post shows how to add DISQUS comments.
This is an example post with image galleries.
Images can be made zoomable. Simply add data-zoomable to <img> tags that you want to make zoomable.
The rest of the images in this post are all zoomable, arranged into different mini-galleries.

If you found this useful, please cite this as:
Kai, Yang Chun (May 2024). a post with tabs. https://Kenyang1218.github.io.
or as a BibTeX entry:
@article{kai2024a-post-with-tabs,
  title   = {a post with tabs},
  author  = {Kai, Yang Chun},
  year    = {2024},
  month   = {May},
  url     = {https://Kenyang1218.github.io/blog/2024/tabs/}
}